The first time I really looked at what Claude Code was doing for me, I'd already been using it for weeks. I knew it was helpful. I had no idea what it was costing, how often it was hitting cache, how many tool calls it was burning per session, or what I was projected to spend by the end of the month.
So I built a dashboard.
If you're running AI agents and you can't see what they're doing in aggregate, you're not running them — they're running you. The terminal shows you one session at a time. The billing page shows you a total in arrears. Neither tells you the story in between, which is where every operational decision actually lives.
This post walks through what I built, why, what's in the stack, and what surfaced once the data started flowing.
The visibility gap
Default observability for Claude Code is generous for a single session and almost nonexistent across many. You can see token counts as a session runs. You can see your bill once a month. The space between — cumulative spend across every session today, cache hit rate, tool call frequency, model mix, errors over time, projected monthly cost, session-over-session deltas — is data that exists somewhere but isn't surfaced by default.
That gap matters more for agents than it ever did for humans typing code. A developer running Claude Code in a tight loop can rack up tens of millions of tokens in an afternoon without realizing it. A bad prompt that doesn't cache well costs 10 times as much as a good one. An agent that retries a failing tool call burns budget invisibly. None of it surfaces until you go looking.
You wouldn't run a production system without observability. AI agents are production systems, even when the production target is "me." Treat them like one.
What Mission Control tracks
The dashboard surfaces the metrics I actually use to make decisions, on three time horizons (today / 7d / 30d):
- Sessions — how many Claude Code sessions I started, with day-over-day comparison and a 7-day rolling average
- Effective tokens — input + output + cache_create. The real spend signal.
- Tool calls — total invocations across all sessions, which catches expensive loops
- Errors — tool failures and session errors, with rate
- Cache hit rate — the single biggest cost lever in agentic workflows
- Token usage by model — Opus vs Sonnet split, so I can see whether I'm reaching for the bigger model when a smaller one would do
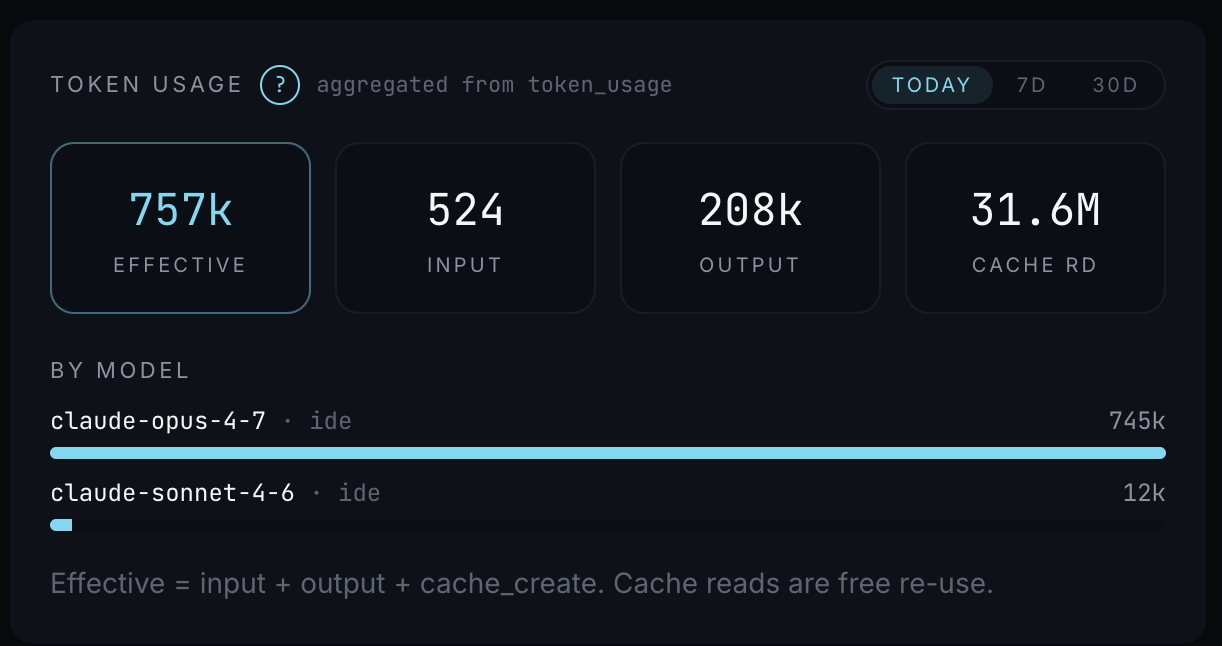
The token panel breaks down into Effective, Input, Output, and Cache Reads. On a typical day, Effective runs in the high six figures, and Cache Reads run in the tens of millions — meaning the vast majority of tokens flowing through the system are free to reuse. That ratio is the number I check first every morning.
Two ambient panels round it out. Security Posture runs Snyk against the application code and against my Claude agent configurations themselves. Agent Posture tracks the MCP servers and skills attached to my Claude instances and flags anything stale or misconfigured.
The stack
Mission Control is intentionally simple. Nothing about it needs to be a hosted service, and the data is mine alone.
- Frontend: Next.js + TypeScript. Server components for the static panels, client components for the live session counter and the time-range toggles.
- Backend: FastAPI (Python). Python is the right choice anywhere telemetry data and an OpenTelemetry collector are involved — the SDK ecosystem is more mature than in Node, and FastAPI is fast enough that I never had to think about it.
- Database: SQLite. A deliberate choice, not a default. Volume is small, access is single-writer single-reader, and SQLite gives zero-configuration durability on the same machine where everything else runs. If this ever becomes multi-tenanted, it changes. For one operator, Postgres would be a ceremony.
- Hosting: local. The whole thing runs on my workstation. Mission Control is a tool, not a product. Hosting it would create an attack surface for no benefit.
- Observability: OpenTelemetry. Claude Code sessions emit OTel traces, and the FastAPI backend collects them. Using the standard means anything I connect later — alerting, additional tools, an MCP layer — speaks the same language out of the box.
- Security: Snyk, in two roles. One scan covers the dashboard codebase itself — dependencies, source, and container if I ever ship one. A second covers my Claude agent configurations — MCP servers, skills, prompts, and tool definitions. AI agents are software. Most people don't scan them.
The non-obvious decision was to separate the agent posture scan from the application security scan. Treating my Claude instances as a distinct attack surface from the dashboard that watches them sounds paranoid until you remember an MCP server is just a process the agent will obediently talk to.
What surprised me
A few things landed harder than expected once the numbers were visible.
Cache hit rate hits 100% more often than you'd think. Once you structure prompts with stable system contexts and put dynamic content at the end, the prefix caches and stays cached. The implication: the headline token count on a session is mostly free cache reads. Effectiveness is what matters.
Cumulative scale is staggering. A single operator running Claude Code through a normal workday touches hundreds of millions of tokens. Not because the work is wasteful — because agentic loops touch context far more times than human-in-the-loop coding ever did. Most cost intuitions from the chat-AI era are off by an order of magnitude.
Day-to-day variance is huge. A heavy build day can be 27× a light one. Anyone budgeting AI spend on a flat monthly average is going to be wrong every month.
Zero errors at this volume is achievable. Recent error count is 0 against 152 tool calls in a day. That's not luck. It's prompt discipline, tight tool definitions, and Snyk catching agent-config issues before they ever ship a bad call.
What changed about how I work
Visibility forces decisions you didn't know you were avoiding.
I switched from "use Opus for everything" to picking by marginal value. The model split panel makes overspend obvious — if Sonnet would have solved it, picking Opus is a tax I now feel. I tightened system prompts to push cache hit rate back above 95% whenever it drifts. I caught one runaway session early because the live token counter ticked past my mental budget and I killed it before it cost real money.
The deeper shift: I stopped reasoning about agent workflows the way I reason about my own code. My code costs my time. Agent workflows cost time, tokens, and tool budget — and those scale very differently. You can only manage what you can see.
Closing
Mission Control is observability for one developer's AI workflow. The same architecture — persistent state, deep tool integration, telemetry, security posture, and a control surface to oversee it all — is what an AI Operating System for a business looks like, scaled up.
That's what we build at Crestwork Studio. If you're running AI in your business and can't answer "what's it actually doing right now?" the answer is the same: build the dashboard.